

Hypothesis Testing in Statistics: Types, Steps, Examples
Home / Hypothesis Testing in Statistics: Types, Steps, Examples

MANAGEMENT
May 13, 2026
Introduction
Hypothesis testing is one of the foundations of inferential statistics, giving researchers, businesses, and data experts a way to turn sample data into decisions they can trust.
Consider this: you might want to test whether a new drug actually works, whether an advertising campaign is increasing sales, or if a new production process is reducing errors. Hypothesis testing provides you a structured way to determine whether the changes you observe are significant, or if they’re just random chance.
This article provides an exhaustive guide to hypothesis testing in statistics, covering:
- What hypothesis testing is and why it matters
- Core concepts: null and alternative hypotheses, p-value, significance level, test statistics, and types of errors
- Stepwise process of hypothesis testing
- Types of hypothesis tests ( includes Z-test, t-test, Chi-square test, ANOVA, non-parametric tests)
- One-tailed testing vs. two-tailed testing
- Real-world examples across business, medicine, and engineering
- Common mistakes, assumptions, and best practices
By the end of this article, you’ll not only understand how hypothesis testing works but also know when and how to apply it effectively.
What is Hypothesis Testing?
Hypothesis testing is a statistical technique employed to make inferences about populations on the basis of sample information. It involves establishing rival assumptions (hypotheses) and making use of the theory of probability to decide which assumption is more well-supported through data.
- Null Hypothesis (H₀): This is the default assumption. The assumption that nothing has changed — no effect, no difference.
- Alternative Hypothesis (H₁ or Ha): The research claim — that something has changed — there is an effect or a difference.
Example:
- H₀: A new online ad campaign does not increase sales compared to the old campaign.
- H₁: The new campaign does increase sales.
The goal is to test whether the observed data provide enough statistical evidence to reject H₀ in favor of H₁.
Conceptual Understanding in Hypothesis Testing
-
H₀ (Null Hypothesis):
- The default assumption or conservative position.
- It claims there is no effect, difference, or relationship in the population.
- Example: “The new medicine has no impact on blood pressure compared to the old one.”
- Think of H₀ as the status quo, what we assume true unless evidence suggests otherwise.
H₁ (Alternative Hypothesis):
- The challenger claims that you seek to support.
- It posits that there is a difference or effect.
- Example: “The new medicine reduces blood pressure more effectively than the old one.”
- H₁ challenges the status quo represented by H₀.
Hypothesis testing works like a trial, where collected data serves as evidence to decide whether to reject H₀ in favor of H₁ or not. The goal is to assess the strength of the evidence against the null claim.
2. Test Statistic
A test statistic is a numerical value based on your sample data that assists in quantifying how much your observed outcomes deviate from what would occur if the null hypothesis (H₀) were true.
Consider it as a score that indicates how distant your data is from the initial assumption (no effect). Typical test statistics include Z, t, and Chi-square values.
This number enables you to determine if the data you've seen is abnormal enough to reject the null hypothesis or if it can be explained by normal chance variation.
3. Significance Level (α)
The significance level (α) is the threshold used to determine whether or not to reject the null hypothesis (H₀) in hypothesis testing. It is a threshold probability, typically established prior to data collection, most often at 0.05 (which implies 5%).
- If your test's p-value is less than or equal to α, you reject H₀, and there is sufficient evidence to accept the alternative hypothesis (H₁).
- If p-value is larger than α, you reject nothing but H₀, and it simply means that there is not enough evidence to reject the null hypothesis.
You will see the p-value and contrast it with α in the output or results of the statistical test that you conduct using software or methods of computation. Most statistical tools — like SPSS, R, Python, or even Excel — will automatically give you the p-value once you run a hypothesis test.
In short, your significance level α is your criterion for determining whether your findings are "statistically significant" and unlikely to be due to chance. It determines how strong the evidence needs to be to reject the null hypothesis.
4. p-Value
The p-value helps you to determine if the results you are seeing in your data are likely just by chance or actually meaningful.
Think of it this way:
- A small p-value means your results would be very unusual if the null hypothesis (H₀) were true. That gives you stronger evidence to question or reject H₀.
- A large p-value means your results are quite possible under H₀. In that case, you don’t have enough evidence to reject it.
In short, the p-value acts like a “signal strength meter.” It tells you whether your findings are strong enough to move away from the null hypothesis and lean toward the alternative.
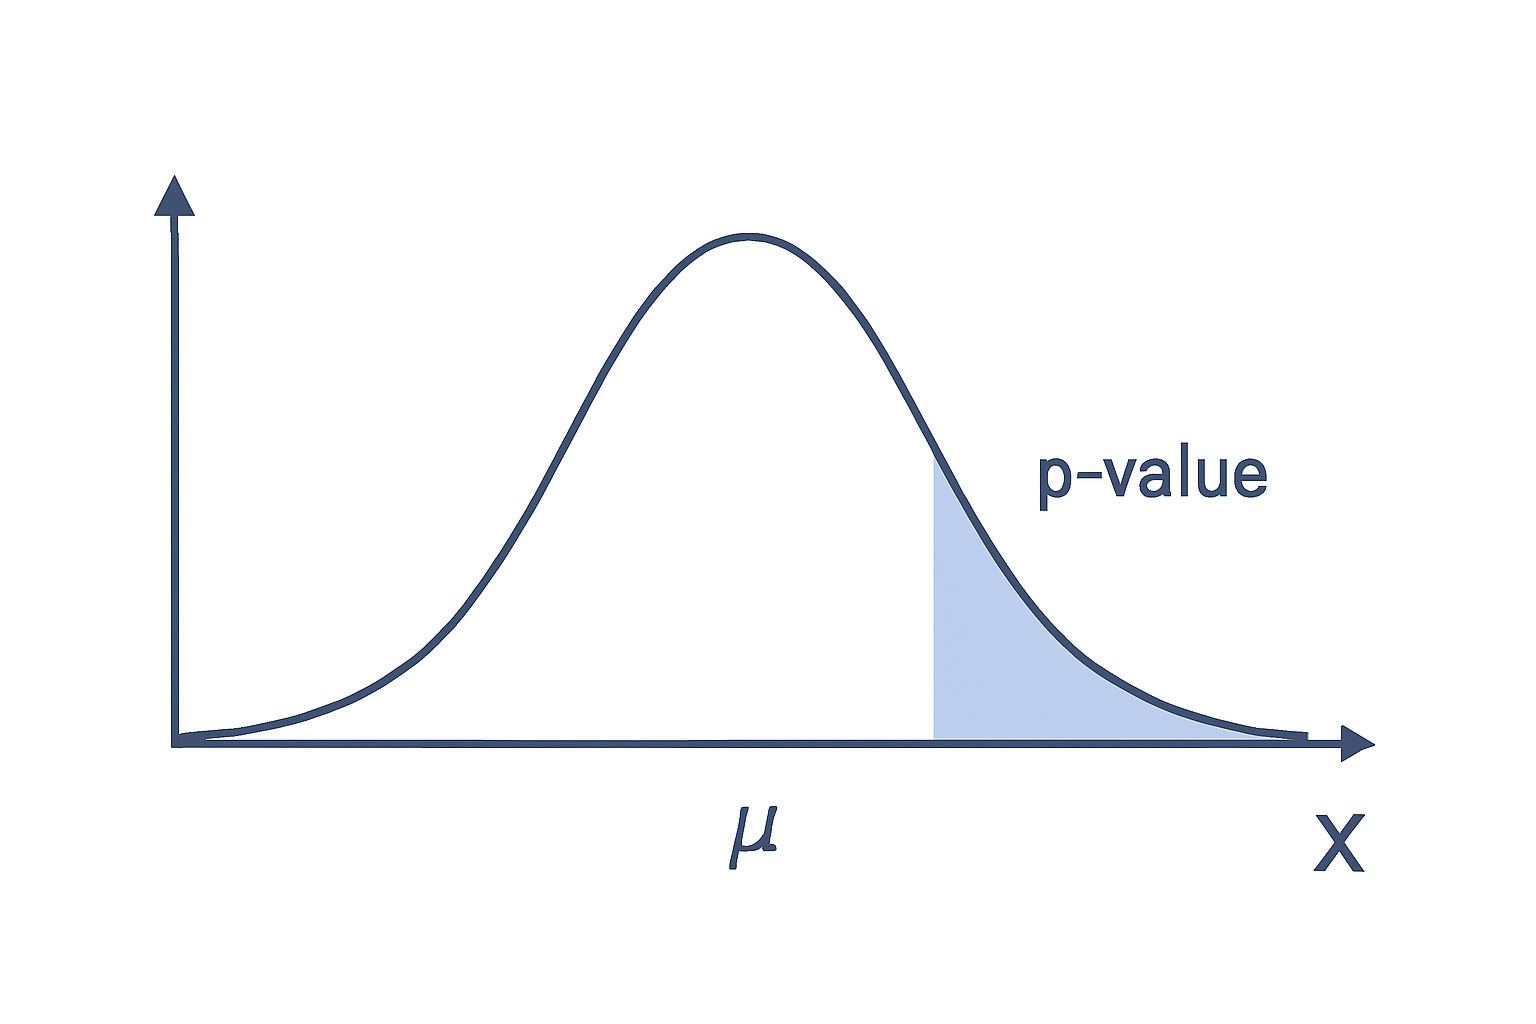
Figure: p-value illustration on a normal curve
- Bell curve centered at H₀.
- Shaded tail regions showing p-value.
- Critical region marked at α.
This shows that the p-value is the “chance of seeing this data (or worse) if H₀ is correct.”
5. Type I and Type II Errors
- Type I Error (α): Rejecting H₀ when it is actually true (false positive).
- Type II Error (β): Failing to reject H₀ when it is actually false (false negative).
Explanation of Errors in This Context
|
Error Type |
What It Means |
Example in Our Context |
|
Type I Error (α) |
Rejecting H₀ when it is actually true |
Saying the medicine works when it really doesn’t. |
|
Type II Error (β) |
Failing to reject H₀ when it is actually false |
Saying the medicine doesn’t work when it actually does. |
When you do a hypothesis test, there are two situations:
- The null hypothesis (H₀) is actually true — meaning there is no real effect or difference.
- The null hypothesis (H₀) is actually false — meaning there is a real effect or difference.
And there are two possible decisions you can make after the test:
- Reject H₀: You say there is an effect or difference.
- Fail to reject H₀: You say there is no effect or difference.
The table shows what happens in each case:
|
What You Decide |
If H₀ is True (No Real Effect) |
If H₀ is False (Real Effect Exists) |
|
Reject H₀ |
Wrong! You said there is an effect when there isn’t (Type I Error) |
Correct! You correctly found the effect. |
|
Fail to Reject H₀ |
Correct! You said there is no effect and there really isn’t one. |
Wrong! You missed the effect (Type II Error) |
In simple words:
- Type I Error: Means saying “Something’s happening!”, i.e. incorrect rejection of a true null hypothesis. It is a false positive indicating an effect where none exists, leading to erroneous validation of an ineffective treatment.
- Type II Error: Means saying “Nothing’s happening”, when actually something is. It is a failure to reject a false null hypothesis; a false negative indicating no effect when one is present, resulting in missed detection of a true effect.
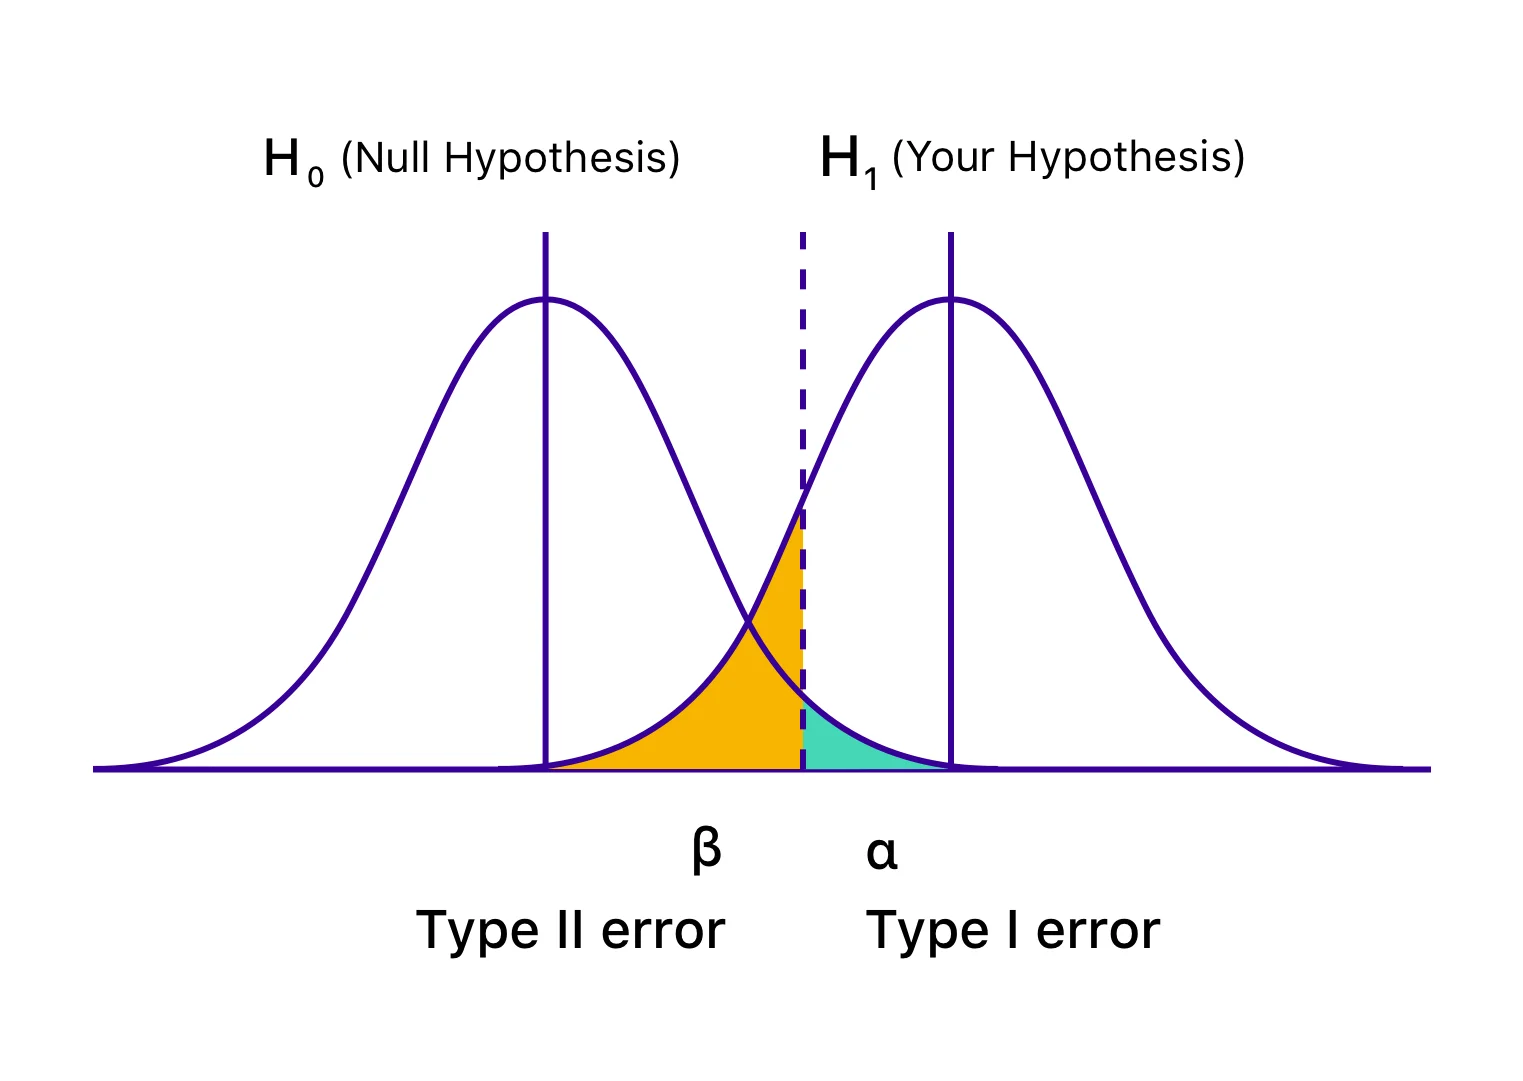
The above figure illisutrates:
Reality: H₀ true → Decision: Reject H₀ → Type I Error
Reality: H₀ false → Decision: Fail to Reject H₀ → Type II Error
Power of a test = 1 – β (ability to detect true effects).
Steps of Hypothesis Testing
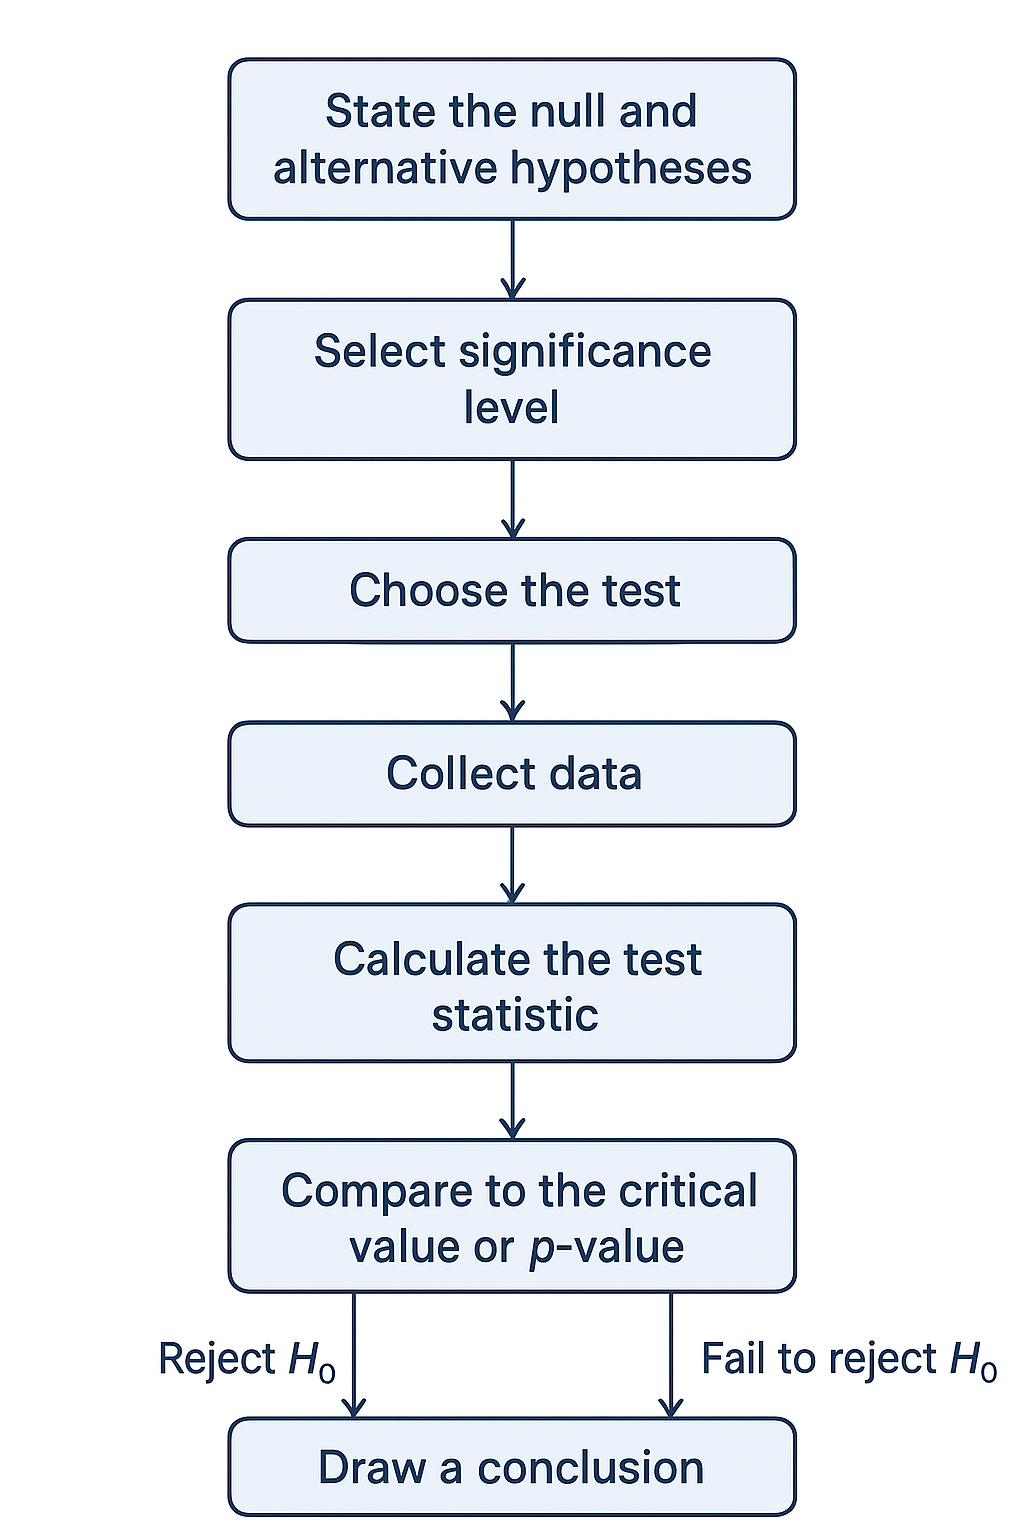
Step 1: Define Your Hypotheses
Every test starts with two simple claims. The null hypothesis (H₀) says “nothing’s happening, no real difference.” The alternative hypothesis (H₁) is the opposite — it’s the idea you want to prove, like “yes, there is a difference or effect.”
Example:
- H₀: This new medicine doesn’t change recovery.
- H₁: The new medicine helps people recover faster.
Step 2: Set Your Significance Level (α)
Before checking the numbers, decide how much chance of being wrong you can live with. Most people go with 5% (α = 0.05). That simply means: “I’m okay with being wrong 5 times out of 100 if I reject the null.”
Step 3: Pick the Right Test for Your Data
Not all tests work the same way. Which one you use depends on your data:
- Z-test → For large samples.
- t-test → For smaller samples.
- Chi-square test → For categories (like yes/no, male/female).
- F-test / ANOVA → When comparing more than two groups.
Think of this step as choosing the right tool from the toolbox.
Step 4: Calculate the Test Statistic and p-Value
Now crunch the numbers. The test statistic is just a score that tells you how far your data is from what the null hypothesis expected. Then comes the p-value — it tells you how surprising your result is if H₀ were actually true.
Step 5: Compare p-Value with α
Here’s the big decision:
- If p ≤ α, your result is strong enough — reject H₀ and say the alternative has support.
- If p > α, your result isn’t strong enough — stick with H₀.
In short: small p-values mean stronger evidence against the null.
Step 6: Make Your Final Decision
Wrap it up with a clear statement. Either say, “Yes, we found strong evidence of an effect,” or “No, the evidence isn’t strong enough to claim a difference.”
Example:
- “The new medicine really does speed up recovery.”
- Or: “We don’t have enough proof that this medicine works better.”
Types of Hypothesis Tests
1. Z-Test
This test is handy when you’ve got a large sample size (usually more than 30) and you already know the population variance. Think of it like checking if the average IQ in a group is really different from 100.
2. t-Test
When your sample is small (30 or fewer) and you don’t know the population variance, the t-test comes into play. It has a few versions:
- One-sample t-test (comparing a group against a known value)
- Independent two-sample t-test (comparing two different groups)
- Paired t-test (before-and-after situations on the same group)
Example: Seeing if two classes perform differently on an exam.
3.Chi-Square Test (χ²)
This one works with categories instead of numbers. It helps you see if two variables are related, like whether purchase preference depends on gender.
4.ANOVA (Analysis of Variance)
If you want to compare more than two groups at once, ANOVA is your tool. For instance, checking if people from low, middle, and high-income groups spend differently.
5.Non-Parametric Tests
When your data doesn’t follow the normal distribution rules, these tests step in. Examples include the Mann-Whitney U test, Wilcoxon signed-rank test, and Kruskal-Wallis test.
One-Tailed vs Two-Tailed Tests
- One-Tailed Test: When you only want to look for an effect in one direction, you use a one-tailed test. For instance, if you are evaluating whether a new medication performs better than the old one, you will only consider results in the "greater than" range. If it turns out worse, you don’t care as much, because that’s not what you’re testing.
- Two-Tailed Test: In contrast, a two-tailed test examines both directions. You're determining if the effect is greater or less. So if you’re testing the same medicine, you’d want to know if it’s either much better or much worse compared to the old one.
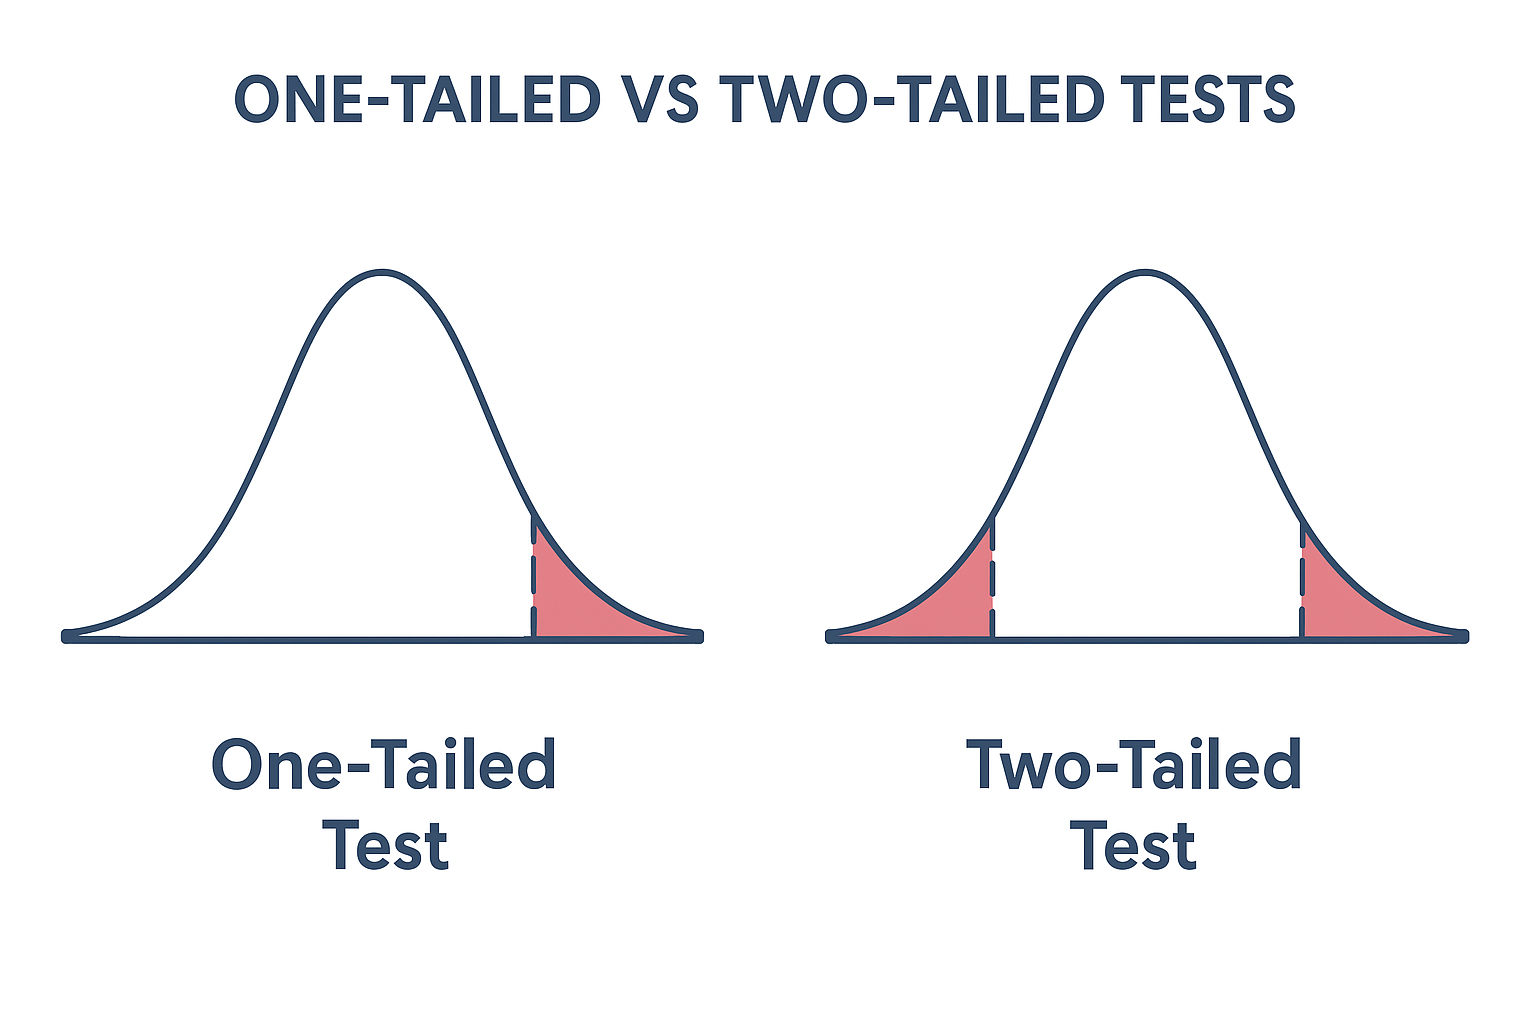
One-tailed focuses on a single direction of effect, while two-tailed considers deviations in both directions.
Practical Examples of Hypothesis Testing
1. Business (A/B Testing)
- H₀: New website layout has no impact on conversion rate.
- H₁: New layout increases conversions.
- Apply a two-sample t-test between old vs new layouts.
2. Medicine (Clinical Trials)
- H₀: New drug is no more effective than placebo.
- H₁: New drug improves recovery rates.
- Apply ANOVA or t-test depending on trial design.
3. Manufacturing (Quality Control)
- H₀: Defect rate is 5%.
- H₁: Defect rate is different from 5%.
- Apply Chi-square test for proportions.
Effect Size and Practical Significance
Statistical significance ≠ practical importance.
- Example: With 1M users, even a 0.1% sales lift might be “significant” at p < 0.05.
- But in practice, the cost of the new campaign may outweigh the benefit.
Always interpret p-value with effect size and context.
Assumptions in Hypothesis Testing
- Random Sampling → Ensures the sample represents the population fairly.
- Normal Distribution → Many tests assume data follows a bell-shaped curve.
- Independent Observations → Each data point must not influence another.
- Equal variances (for ANOVA, t-test) → Groups compared should have similar variability.
Violating these can lead to misleading conclusions.
Common Misconceptions
- “A p-value < 0.05 proves H₀ false.” (It only shows evidence against H₀.)
- “Failing to reject H₀ proves it true.” (It just means insufficient evidence.)
- “Statistical significance means practical relevance.” (Effect size matters.)
Hypothesis Testing in the Age of Big Data & AI
- Large datasets make even trivial effects “significant.”
- Researchers now emphasize:
- Effect size
- Confidence intervals
- Robust testing methods (bootstrapping, Bayesian approaches).
FAQs:
Q1. What is the difference between - one-tailed and two-tailed test?
A one-tailed test looks for an effect in one direction only. While a two-tailed test checks both directions.
Q2. Why is α = 0.05 commonly used in Hypothesis testing?
The value of α = 0.05 as it balances false positive risk (Type I error) and sensitivity.
Q3. Can a p-value be exactly zero?
No. It can be extremely small but never exactly zero.
Q4. What is test power?
Power = 1 – β. This is the probability of detecting an actual effect.
Q5. What if data doesn’t meet assumptions?
In that case, you have to use non-parametric tests (e.g., Mann-Whitney, Wilcoxon).
Conclusion
Hypothesis testing is one of the clearest and powerful statistical techniques to turn data into real decisions. When you set up the right question, pick the right test, and look beyond just the p-value, you lower the chance of mistakes and uncover what’s actually happening. Whether you’re trying to boost sales on a website, check if a new medicine really works, or keep product quality steady, hypothesis testing gives you a solid base for making choices backed by evidence.
Latest Updates & Articles
Stay Connected !! To check out what is happening at EIMT read our latest blogs and articles.

Jul 1, 2026

Jun 23, 2026


Jun 1, 2026

May 20, 2026

May 13, 2026